
MAP OF HISTORICAL DATA FOR THE CAMPANIA REGION
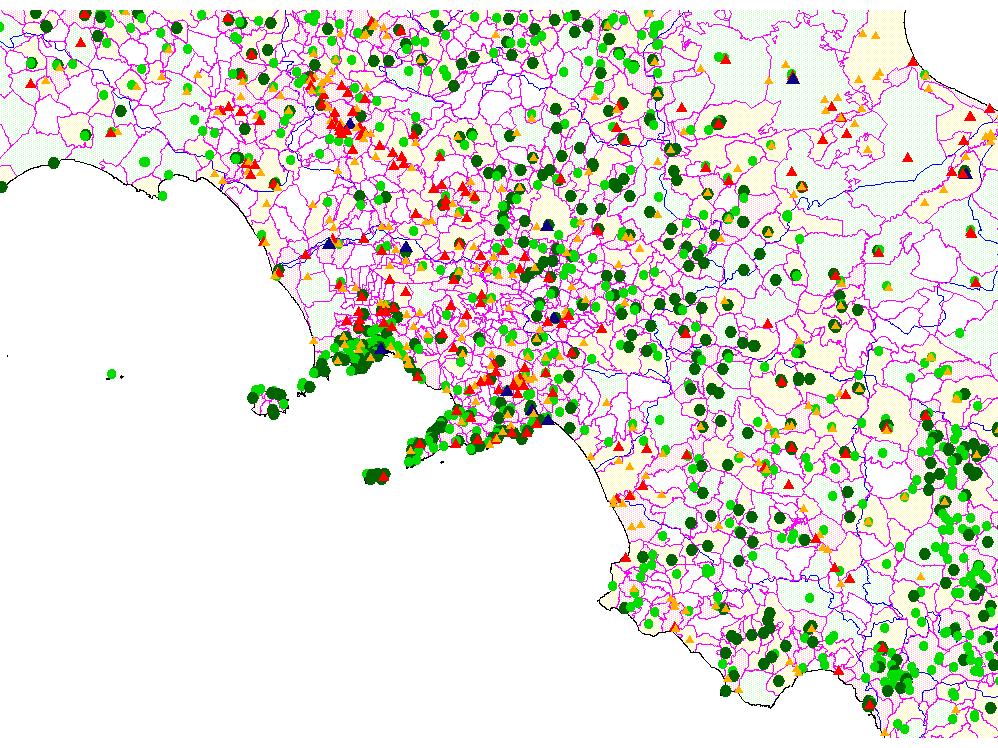
Legend
Small green dots are landslide sites affected once
Large green dots are landslide sites affceted recursively
Orange triangles are inundation sites affected once
Red triangles are inundation sites affected 2-10 times
Blu triangles are inundation sites affected more than 10 times
Green areas are municipalities with a low density of sites (both landslides and floods)
Yellow areas are municipalities with a medium density of sites (both landslides and floods)
Red areas are municipalities with a high density of sites (both landslides and floods)
White areas are municipalities for which no information is available in the historical database
Site density is computed on a national base
The map was prepared using only the historical data inventoried by the AVI project; it does not represent ah hazard or a risk map.
